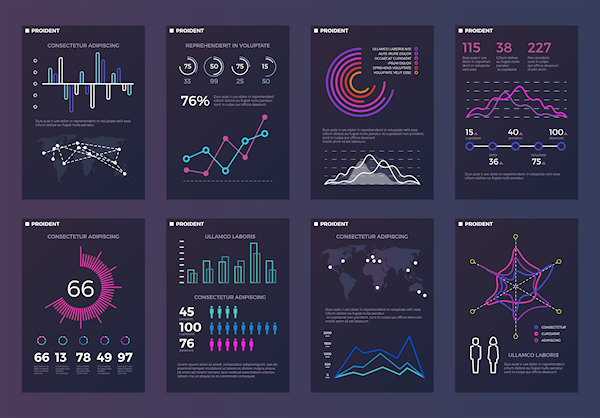
Utilizing big data visualization charts makes it easy to spot trends in sales and marketing efforts, and any possible blockers like production lulls or sudden increases in KPIs before they become larger issues.
Visuals are much easier for the human mind to process than flat table reports, enabling decision makers to quickly gain new data insights and take necessary actions for business expansion.
Increased Productivity
Visualization tools provide companies with access to real-time information and provide management with invaluable assistance. Decision-makers can rapidly analyze data and absorb critical metrics quickly for faster decision-making resulting in increased productivity within business operations and increased overall performance within an organization.
Data visualization not only speeds up decision-making processes but also enhances understanding. Visualizing data allows teams of diverse members, even those without technical expertise, to get on the same page when discussing key findings.
When everyone understands a set of insights quickly enough, businesses can take swift action based on them to expand and grow faster.
Data visualization also aids in uncovering data trends more readily. When data is presented visually, it becomes much simpler to detect patterns that would otherwise go undetected when looking at raw data tables alone.
With visual data discovery tools, it’s easier than ever for companies to detect outliers within their data, enabling swift action to prevent losses, outshine competitors, or capitalize on unexpected market conditions. You can click the link: https://www.itl.nist.gov/ to learn more about data outliers.
Improved Decision-Making
Data visualization tools enable users to rapidly access key business information and reduce response times, which is especially beneficial for companies that rely heavily on it in their daily operations.
A sales manager could benefit from having market trend analysis available just in case a client asks for specific statistics from recent marketing campaigns – instead of having to answer, “I will get back to them later”, thus saving time.
Visualizations help users focus on the most important aspects of data. Instead of providing confusing industry jargon-filled results, visualizations deliver only pertinent info in an easily understandable format allowing decision-makers to quickly zero in on information they care most about and make effective business decisions.
Visual presentations make team collaboration simpler, allowing everyone access to the same data at once, which helps them come to a consensus faster than with traditional spreadsheets. This benefit of data visualization makes implementing best practices identified in data much simpler, leading to a more productive workplace. This is an advantage especially valuable in highly competitive industries that must stay ahead of their competition.
Increased Sales
Businesses that can quickly interpret data can more efficiently optimize product development and customer service.
By visually representing past purchase data and analyzing customer feedback, companies can quickly spot products that are underperforming as well as develop features or enhancements tailored specifically to meeting customer requirements.
Data visualization is a great way to explain trends and insights to both internal and external audiences. Its most widespread use lies with marketers, who use real time web traffic data visualization techniques to present customer traffic flows that generate sales conversions. You can visit this site to learn more about web traffic statistics.
Business users using online data visualization software can quickly create their own graphs and charts to communicate their findings more quickly. Humans process visual images 60,000 times faster than text; visualization also aids comprehension of large amounts of complex information.
Data visualization allows marketing teams to optimize their digital marketing strategies in order to target specific audience groups and increase web traffic, ultimately leading to more sales and increasing revenue for the business.
Additionally, decision makers can recognize new patterns in data that indicate red flags or progress and take steps necessary to move their company forward by making adjustments or changes accordingly. By recognizing key trends within data, businesses can create personalized communication that leads to sales conversions and accelerates their commercial expansion.
Increased Transparency
Businesses increasingly collect massive amounts of data and require a way to quickly understand what is going on within their organizations. With data visualization tools, this became possible; you could now quickly spot trends and patterns which may otherwise be difficult to detect using just tables of numbers.
Data visualization can also help quickly detect any systemic errors and correct them immediately, thus helping prevent costly production downtime and ensure people’s safety.
Effective visualization depends on making sure the data ties in closely with business objectives, is easily understood by all team members, and is easily consumed.
One way of accomplishing this goal is selecting visuals designed specifically for certain types of data. Furthermore, testing visuals with one person prior to showing it to others ensures any issues can be corrected before going public.
Data visualization is an indispensable asset in today’s competitive business environment and must be employed effectively if you hope to sustain a competitive edge. Data visualization enables fast discovery and sharing of insights within teams – helping increase productivity and sales while making decisions which help you achieve business goals.

